


October 13, 2022
•
...
At Paradigm, we need to deliver trading notifications and market data to our customers reliably and with the least latency possible. These messages contain instrument prices and measures, order book information, quotes, and trade execution notifications. Our clients rely on this data to make quick trading decisions. To deliver this data, we operate several different WebSockets-based services across our products. Among these is a Python-based service, built using Django Channels.
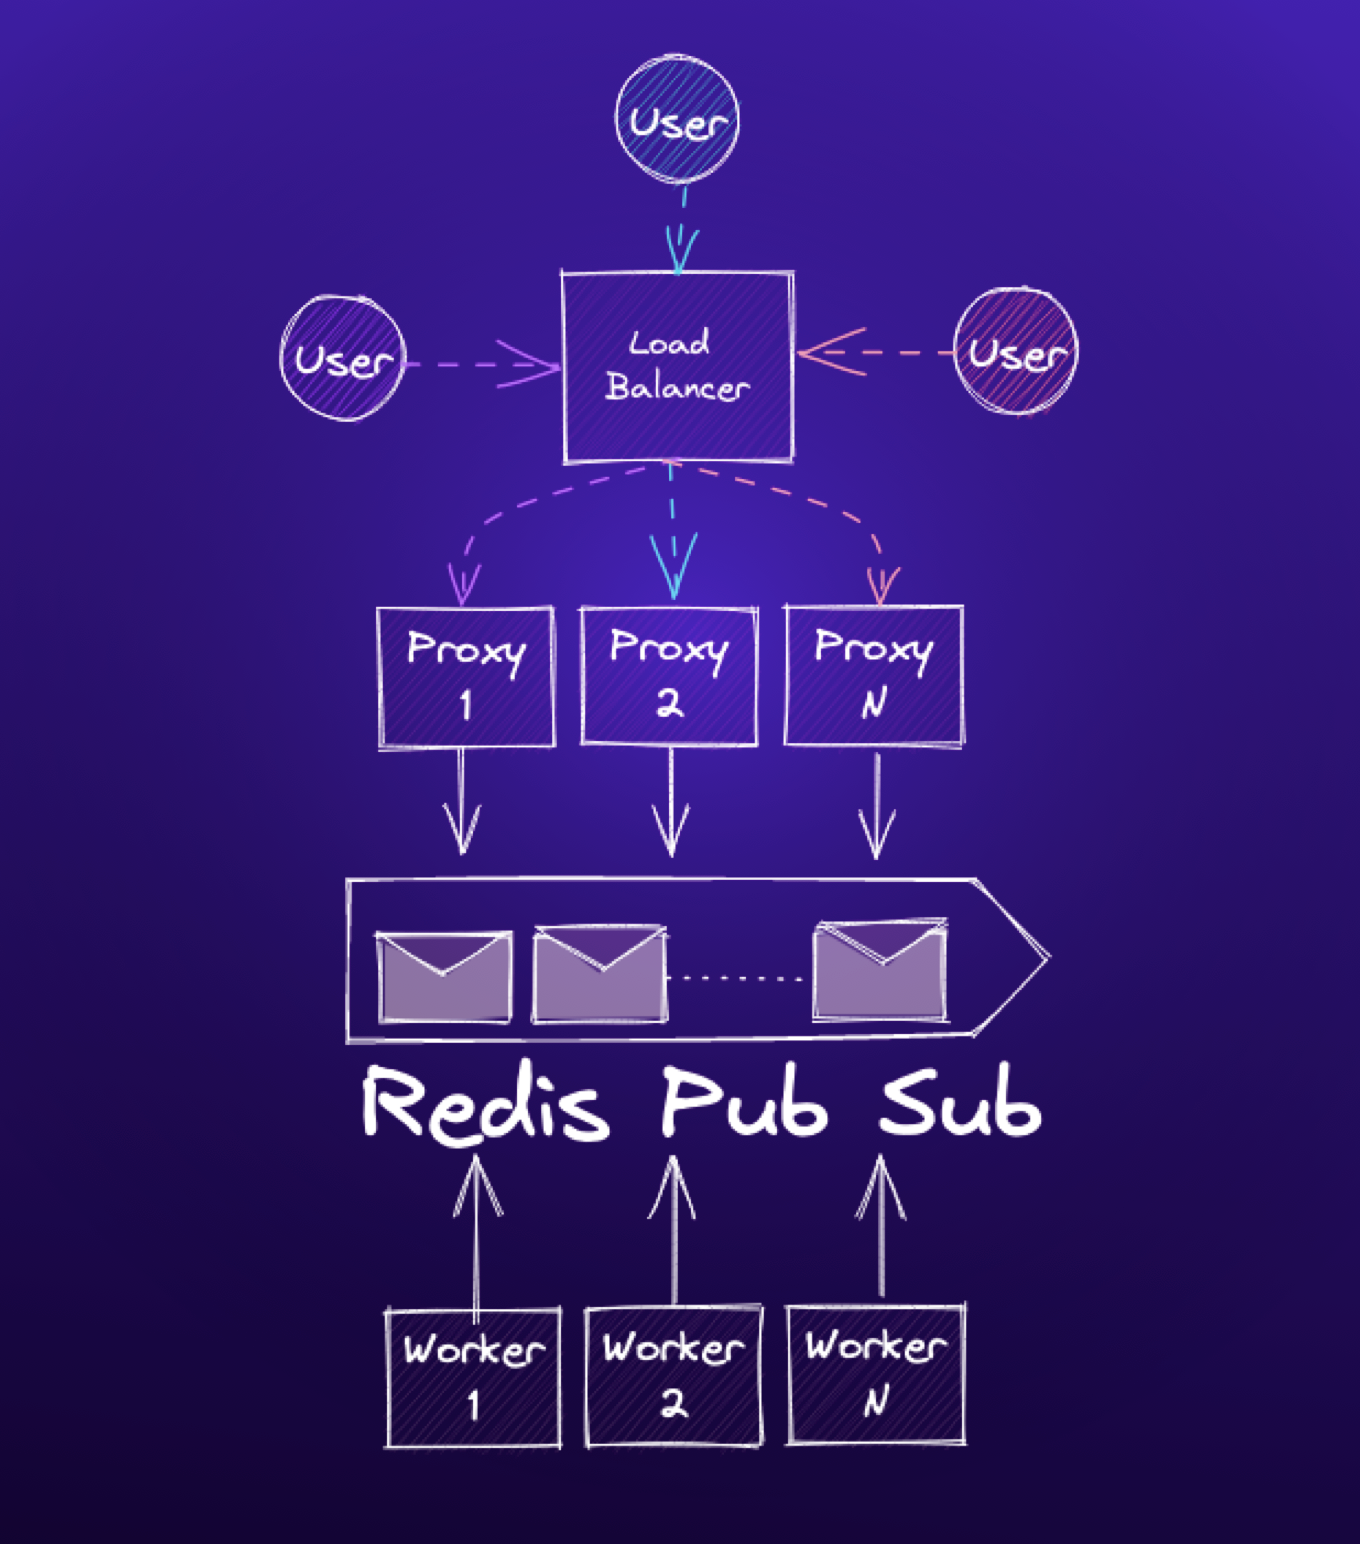
Our architecture includes a number of workers that publish messages to a Redis PubSub backend. We operate many WebSockets frontend proxies, which sit between end users and our backend, maintain persistent WebSockets connections with clients, and manage connection state such as channel subscriptions. The proxies are themselves Django applications, and run under the Daphne ASGI server.
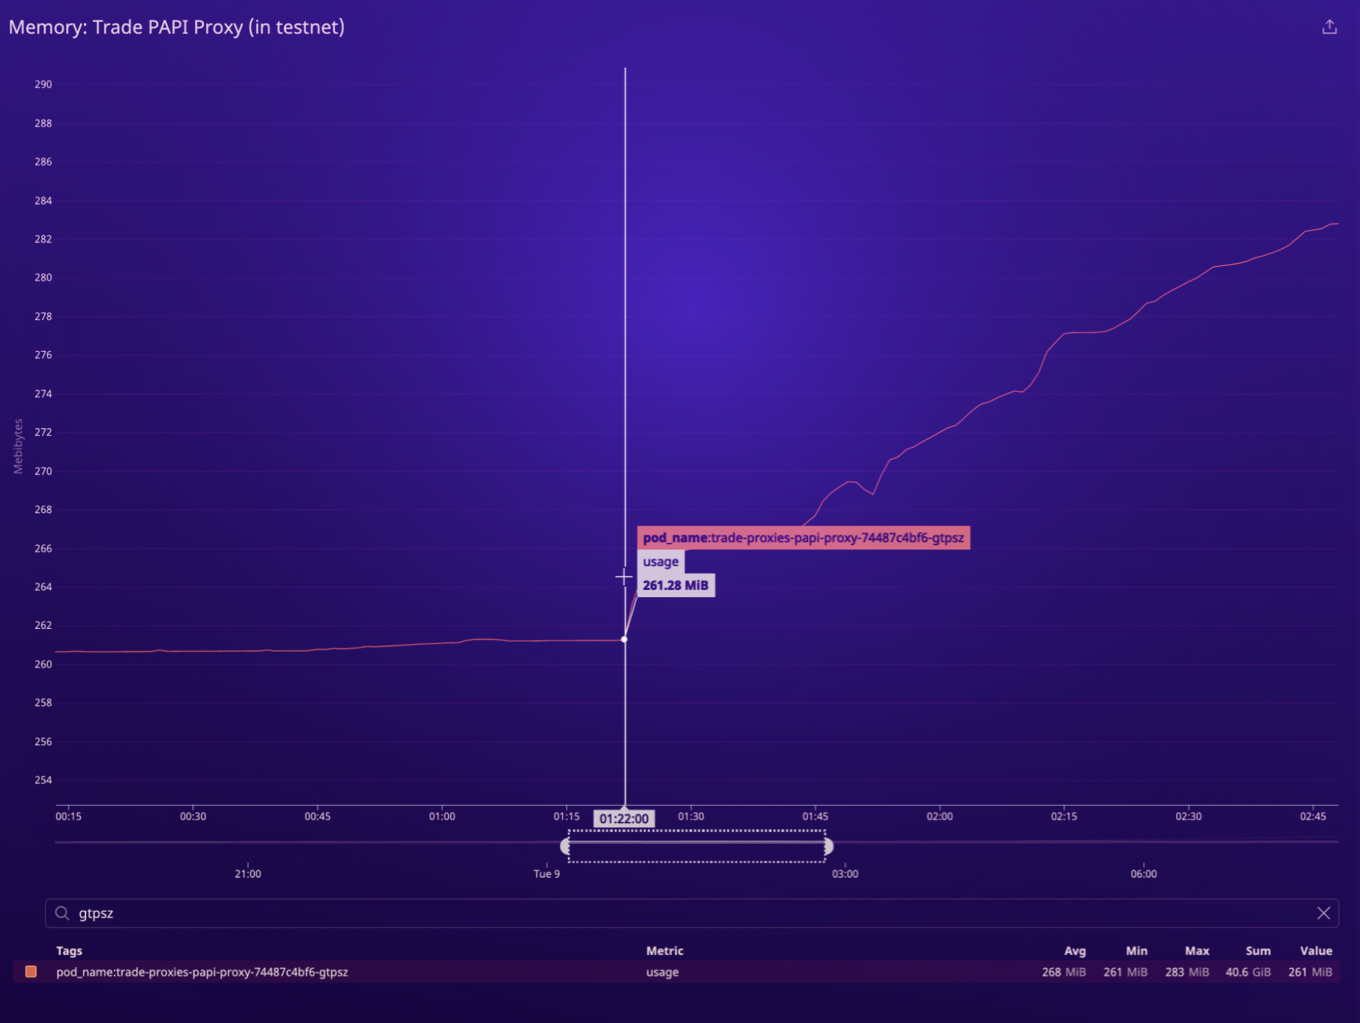
Recently, we were alerted to abnormal memory growth in these proxy servers. The graph below shows the memory usage of each of our WebSockets proxy pods over a period of one week. Each pod starts out with low memory usage, but over time more nodes begin to experience memory growth.
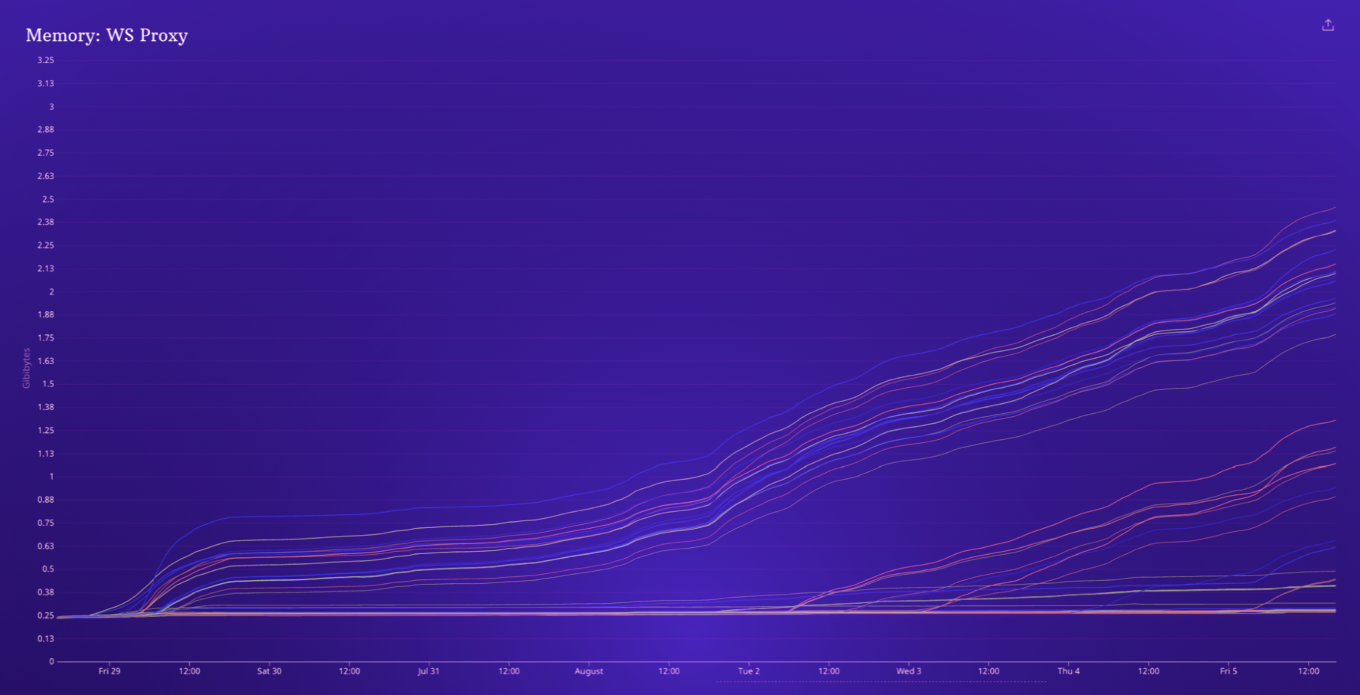
While our infrastructure will automatically restart pods that develop high memory usage, there were still sometimes periods of increased WebSockets latency as individual pods began to experience high memory usage. When these pods were restarted, clients connected to those nodes would drop their persistent WebSockets connections, leaving customers temporarily blind to trading notifications and market movements.
It was clear from memory usage graphs that there was a triggering event which was causing the excessive memory growth. Memory usage started out flat, but over time more and more of our proxies would exhibit high memory growth. Once these servers entered this state, memory growth would continue, with the rate of memory growth falling and increasing along with traffic levels.
We had recently migrated from Django Channel’s RedisChannelLayer backend to the RedisPubSubChannelLayer, which is newer, and utilizes Redis’ Pub/Sub functionality for message dispatch, and it seemed that this problem began shortly after that migration. Issues reported to the channels_redis project revealed similar issues, but not an obvious fix.
We use Datadog extensively for observability, so our first stop was to Datadog APM’s Live Heap View, which shows a view of where all live objects were allocated. After identifying a pod exhibiting the problem, we could clearly see a problem:
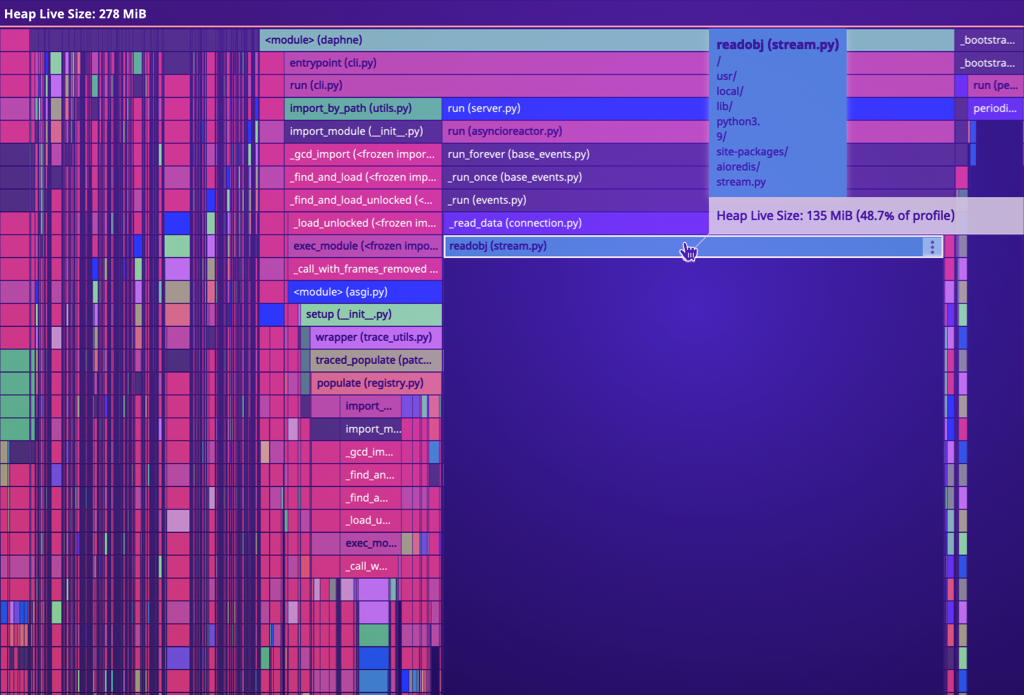
Datadog’s APM Live Heap View displays a flame graph of memory usage, with memory grouped into the modules and functions where the memory was first allocated. The width of the graph indicates the amount of memory held, while the depth is just the stack of the allocation.
In pods that exhibited high memory usage, there was an abnormal amount of memory used by objects allocated in aioredis.readobj(). This was a helpful clue, but not enough to help us determine where and why the memory was being held, only where it had been initially allocated. However, the fact that the memory had been allocated in aioredis indicated that the leaked objects were the WebSockets messages themselves.
With that knowledge in hand, we set out to try and duplicate the problem with a toy example, based on the flow in our application: users connect via Daphne, which is running Django Channels, which in turn instantiates an AsyncConsumer class for every connection. Users send a list of channel subscriptions, and the consumers add users to those groups and relay messages to them. Users send a heartbeat every few seconds to keep the connection alive. When users disconnect, their channel subscriptions are discarded and their connections are cleanly shutdown.
In the code block below, notice that we integrated Python’s tracemalloc package, to record memory allocation data, in much the same way as Datadog’s APM Live Heap View. For every N messages sent, we record a tracemalloc heap snapshot.
The code block below is an example of this flow, mimicking the flow in our proxies:
- Django and Django Channels are configured and initialized
- An async reader function subscribes to a group, and reads messages as quickly as possible
- An async sender function sends messages to the group as quickly as possible
- Once every 1000 messages, we use the tracemalloc package to take a heap snapshot
import asyncio
import random
import string
import tracemalloc
import channels.layers
import django
from django.conf import settings
tracemalloc.start()
CONFIG = {
"CHANNEL_LAYERS": {
"default": {
"BACKEND": "channels_redis.pubsub.RedisPubSubChannelLayer",
"CONFIG": {
"hosts": ["redis://localhost:6379/0"],
"expiry": 15,
},
}
},
}
settings.configure(**CONFIG)
django.setup()
group_name = "default"
counter = 0
message = {
"type": "notification",
"data": "foobar",
}
def tracemalloc_snapshot():
global counter
if (counter := counter + 1) % 1000 == 0:
snapshot = tracemalloc.take_snapshot()
top_stats = snapshot.statistics("lineno")
print(f"Top 10 Allocations (message #{counter})")
for stat in top_stats[:10]:
print(stat)
async def run():
# Open channel layers
channel_layer = channels.layers.get_channel_layer()
# Async function to receive messages as quickly as possible
async def receive():
# Create a new channel and subscribes it to the group
async def new_channel():
c = await channel_layer.new_channel()
await channel_layer.group_add(group_name, c)
return c
channel_name = await new_channel()
while True:
await channel_layer.receive(channel_name)
async def send():
# Send the same test message as quickly as possible while True: await channel_layer.group_send(group_name, message) tracemalloc_snapshot() await asyncio.gather(receive(), send())asyncio.run(run())
The output from tracemalloc shows the live heap memory held, grouped together by the module and function that allocated the memory:
Top 5 Allocations (message #50000)
<frozen importlib._bootstrap_external>:647: size=6582 KiB, count=68205, average=99 B
<frozen importlib._bootstrap>:228: size=169 KiB, count=1493, average=116 B
django/utils/functional.py:138: size=164 KiB, count=1752, average=96 B
tracemalloc.py:67: size=125 KiB, count=1997, average=64 B
<frozen importlib._bootstrap_external>:123: size=92.6 KiB, count=613, average=155 B
The tracemalloc output above shows the top 5 allocation spots. If we had re-created a memory leak, we would expect to see the leak location grow larger, eventually moving into the top 5, and continuing to grow over time. However, our example showed no memory growth. The tracemalloc snapshot was largely static.
We tried to simulate several common problems to reproduce the problem:
- Slow consumers that subscribe to a channel, but only very slowly read messages from the channel
- Flakey consumers, that connect and reconnect repeatedly
- Unclean shutdown, where consumers disconnect with a timeout, or an exception
- Consumers that are disconnected by failing to send heartbeats
- Race conditions with consumers that subscribe and unsubscribe rapidly
Unfortunately, none of these attempts yielded a reproducible test case.
With the knowledge from the Datadog APM Live Heap View that the memory was allocated in aioredis.stream.readobj(), we investigated the source of that module. Within aioredis, readobj() is called exactly once, and any read data is added to an asyncio.Queue.
We interact with aioredis using the channels-redis RedisPubSubChannelLayer backend. Within RedisPubSubChannelLayer, there is logic to handle group subscriptions. When a client connects, a new channel is created, modeled by an asyncio.Queue. When a user subscribes to a group, the user’s WebSockets channel is added to a list of receivers for that group channel. When a message is sent to a group, the receivers for that group are iterated over, and the message is delivered to the subscriber’s channel.
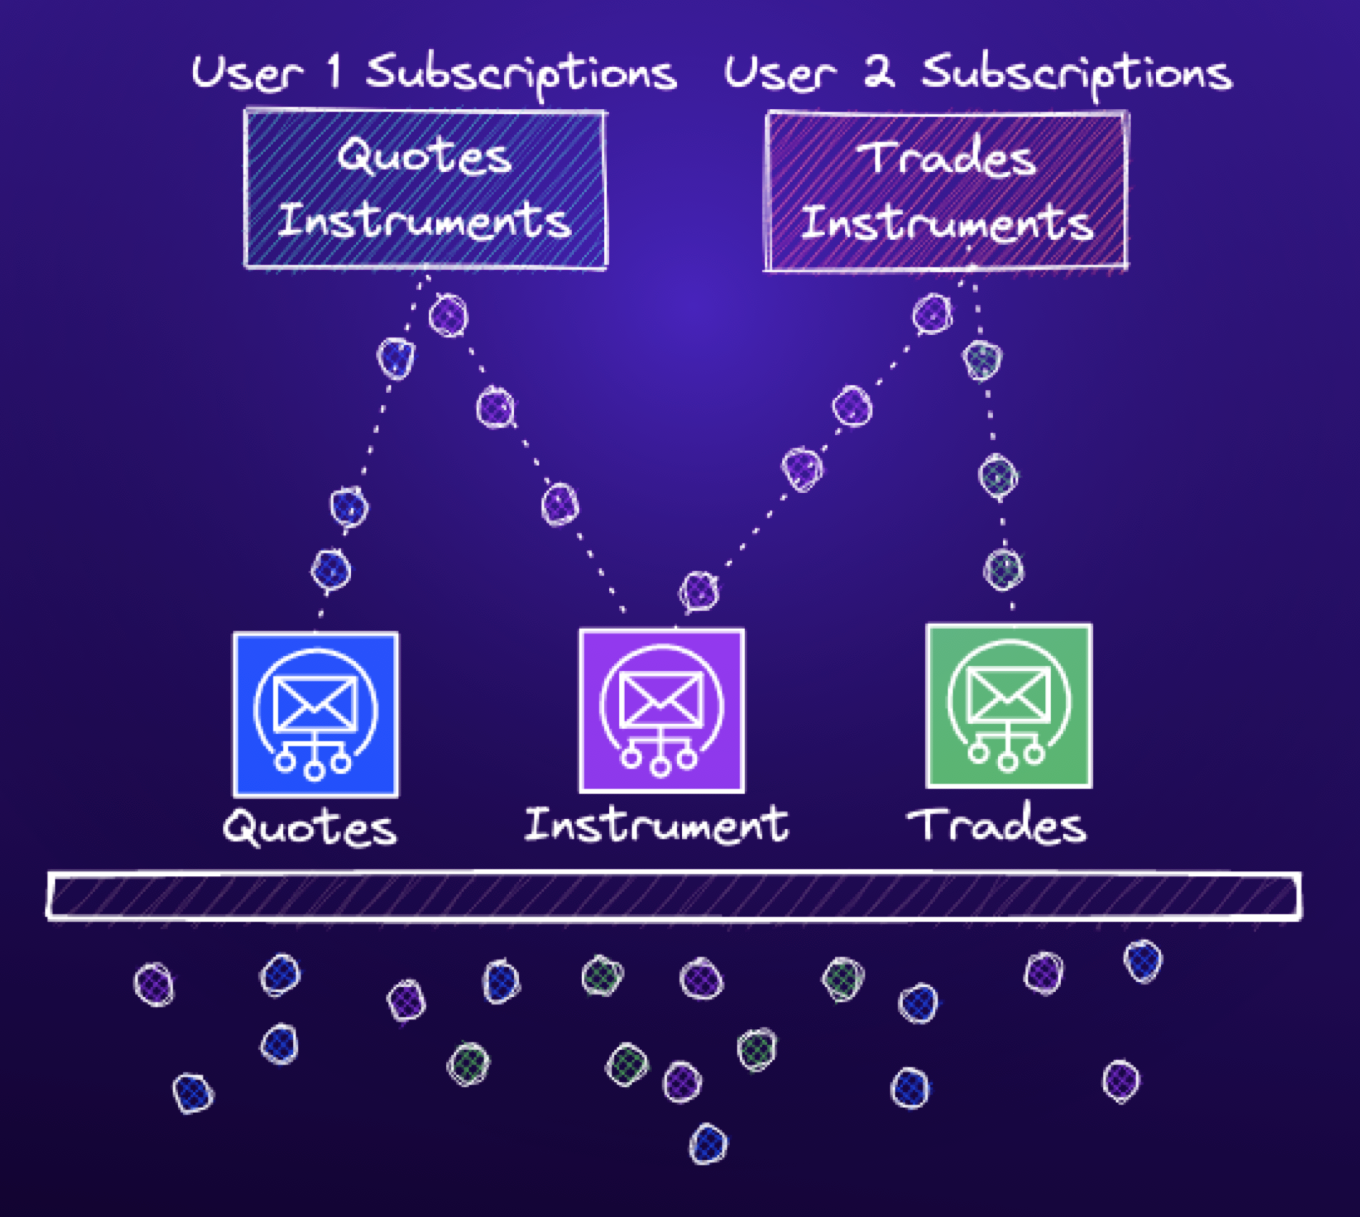
This led us to test multiple users subscribing to the same group, where one subscriber stops receiving any messages.
async def receive():
# Create a new channel and subscribe it to the group
async def new_channel():
c = await channel_layer.new_channel()
await channel_layer.group_add(group_name, c) return c
# Crucially, open two channels, each subscribed to the group
# But only receive from one channel
await new_channel() # Create a channel, but abandon it channel_name = await new_channel()
while True:
await channel_layer.receive(channel_name)
The code block above is the same as our previous test, except two channels are created. Each of the channels are subscribed to the same group, but only one of them receives any data.
This led to a reproducible memory leak which looked very similar to what we were seeing in Production:
After 10,000 iterations, tracemalloc showed a several megabytes of memory in-use that had been allocated in aioredis.stream.readobj():
Top 5 Allocations (message #10000)
aioredis/stream.py:86: size=10.3 MiB, count=10007, average=1083B
<snip>
Every message sent to this group would now leak. This gave us an area to focus on. We once again looked over our logic that handled subscriptions/unsubscriptions and client disconnects, but could not find any glaring problems. Any disconnect would gracefully discard a channel from a group subscription. Any exceptions were caught and handled.
With our new knowledge in hand, we decided to take another pass at log analysis. We zoomed-in on our memory graphs to the moment that a particular proxy pod began to experience higher memory usage.
We looked at logs for this particular proxy node for the minutes surrounding the deviation in memory usage, and among the many other log messages, we quickly noticed a previously-missed, single exception:
Application instance <Task pending name='Task-2540481' at asyncio/futures.py:384, took too long to shut down and was killed.
Somehow, one of our consumer tasks was being uncleanly killed. Looking through our application stack, we found where the warning was logged within our ASGI server, Daphne:
if disconnected and time.time() - disconnected >
self.application_close_timeout:
if application_instance and not application_instance.done():
logger.warning(
"Application instance %r for connection %s took too long to shut down and was killed.",
application_instance, repr(protocol),
)
application_instance.cancel()
Daphne was killing our task because the client had disconnected, but our task had not shutdown within application_close_timeout, which is 10 seconds by default. To test this new theory, we simply added a 10 section sleep to our consumer tasks, which quickly caused Daphne to kill our task, and cleanly reproduce the memory leak in our application.
Within our WebSockets proxies, we implement custom logic upon disconnection. Our clients can optionally connect to our WebSockets proxies with a feature called Cancel on Disconnect. When this feature is active, any disconnection in the WebSockets connection causes Paradigm to cancel any open orders, to prevent any open orders executing while a client is not able to receive and respond to market data.
This feature was implemented using Django Signals. When a client disconnects from our proxies, we emit a signal indicating the disconnection. Cancel on Disconnect is implemented as a receiver of this signal. Importantly, when a Django signal is received, the receiving code is executed synchronously in the context of the sender. If some event happened which caused this process to take longer than 10 seconds, our consumer task would be unceremoniously killed by Daphne.
Crucially, within our WebSockets proxies, the Cancel on Disconnect logic executed before any channel subscriptions were discarded. When the consumer tasks were killed by Daphne, they were killed before they could discard their channel subscriptions.
As mentioned earlier, we had recently migrated from Django Channels’ RedisChannelLayers backend to the RedisPubSubChannelLayer backend. Prior to this migration, we had not experienced any memory leakage. This was puzzling, because our bug with discarding channel subscriptions was not directly related to RedisPubSubChannelLayers. Comparing the two backends revealed an important implementation difference: while RedisChanneLayers also models channels as an asyncio.Queue, the queue is bounded:
class BoundedQueue(asyncio.Queue):
def put_nowait(self, item):
if self.full():
# see: https://github.com/django/channels_redis/issues/212
# if we actually get into this code block, it likely means that # this specific consumer has stopped reading
# if we get into this code block, it's better to drop messages
# that exceed the channel layer capacity than to continue to
# malloc() forever self.get_nowait()
return super(BoundedQueue, self).put_nowait(item)
We were likely experiencing the same problem with RedisChannelLayers, but the problem was hidden from us because of this usage of BoundedQueue.
Memory leaks are often the confluence of several different problems. In our case, this bug required that:
- We were running under the Daphne ASGI Server
- Utilizing the RedisPubSubChannelLayers backend, with its unbounded channel queue
- Custom logic in the group subscription and disconnect logic
- Our custom logic blocked for longer than ten seconds before discarding channel subscriptions.
Ultimately, this problem was solved simply by ensuring disconnect and channel cleanup logic executed before any other custom logic. (The long-running and synchronous custom disconnect logic was addressed separately).
If you’re among those of us that love system performance monitoring, site reliability engineering, bug hunting, or addressing problems like these, Paradigm is hiring!

Heading 1
Heading 2
Heading 3
Heading 4
Heading 5
Heading 6
Lorem ipsum dolor sit amet, consectetur adipiscing elit, sed do eiusmod tempor incididunt ut labore et dolore magna aliqua. Ut enim ad minim veniam, quis nostrud exercitation ullamco laboris nisi ut aliquip ex ea commodo consequat. Duis aute irure dolor in reprehenderit in voluptate velit esse cillum dolore eu fugiat nulla pariatur.
Block quote
Ordered list
- Item 1
- Item 2
- Item 3
Unordered list
- Item A
- Item B
- Item C
Bold text
Emphasis
Superscript
Subscript
