


March 30, 2023
•
...
Our previous options education article discussed calendar spreads and their multifaceted use case for income generation, trading term structure, and taking directional bets. The calendar spreads’ use of multiple expirations allows for different views over time and the opportunity to trade the volatility surface – specifically volatility term structure.
In this article, we will discuss ratio spreads (which also have a variety of use cases implementable in a traders’ portfolio of options) and go into one of the exciting aspects a ratio spread allows a trader to do regarding taking a view on the other aspect of the volatility surface – volatility skew.
What is a ratio spread?
Ratio Spreads can also be called “back spreads” and “front spreads.” A back spread is the opposite of a front spread and vice versa. A front ratio spread has more short contracts than long contracts, and a back ratio spread has more long contracts than short contracts. For me, it’s easier to just look at ratio spreads in terms of what I’m buying or selling than classifying something into a back spread or a front spread and using terminology like long or short, as it can get quite confusing.
You might notice that these ratio spreads look like simple debit/credit spreads, but with an extra option or few extra options involved, this extra optionality serves to add a bit more complexity to the structure and cause the Greeks and where spot is trading (closer or further from the larger # of contracts) when it comes to thinking about P/L. The key difference between a ratio spread and a debit or credit spread is that the number of options executed per leg of the structure is unequal. The most typical example of a ratio spread would be a 1x2 (also known as a one-by-two), which can just be a single credit or debit spread with an extra contract added in.
For technicality and naming conventions, a 1x2 call ratio would be a back spread if we’re selling a call closer to ATM and buying two calls further OTM (think of a call credit spread with an extra OTM call). It would be a front spread if the 1x2 call ratio bought a call closer to ATM and sold two calls further OTM (think of a call debit spread with an extra OTM call sold). *Note expiries are the same.
Throughout this article, I will emphasize whether we are buying or selling the leg with multiple contracts involved to prevent any confusion.
Why would someone use a ratio spread?
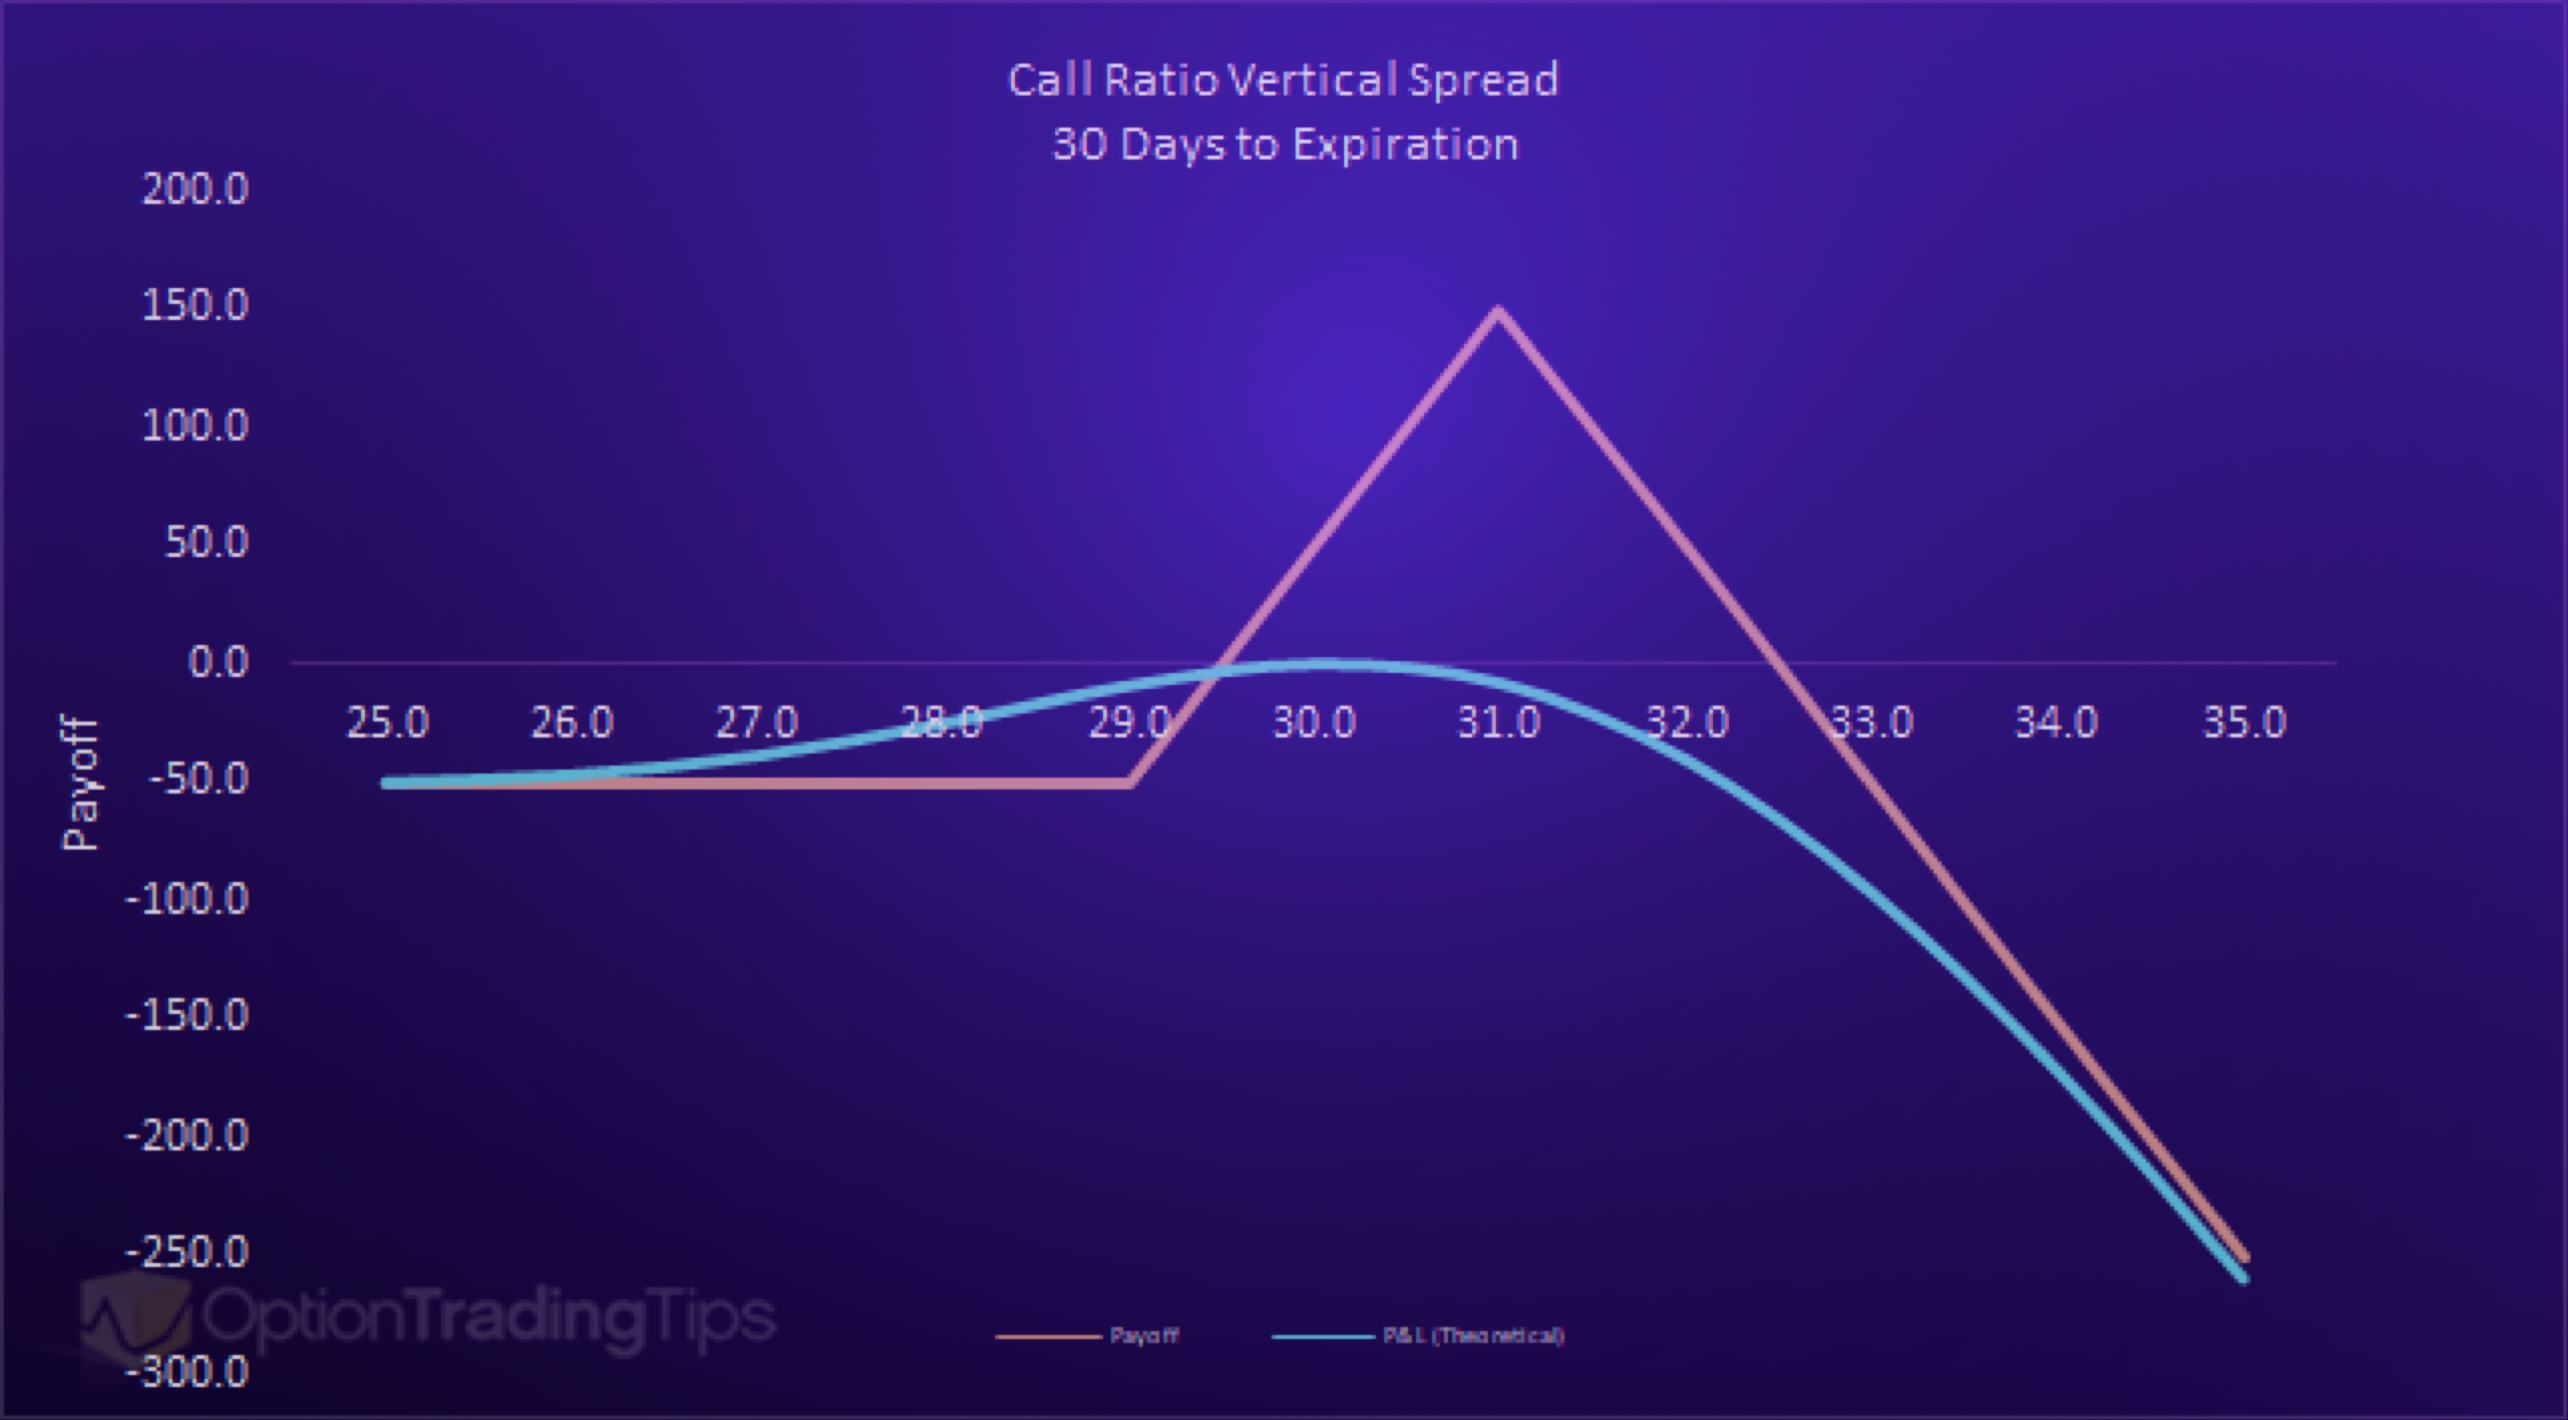
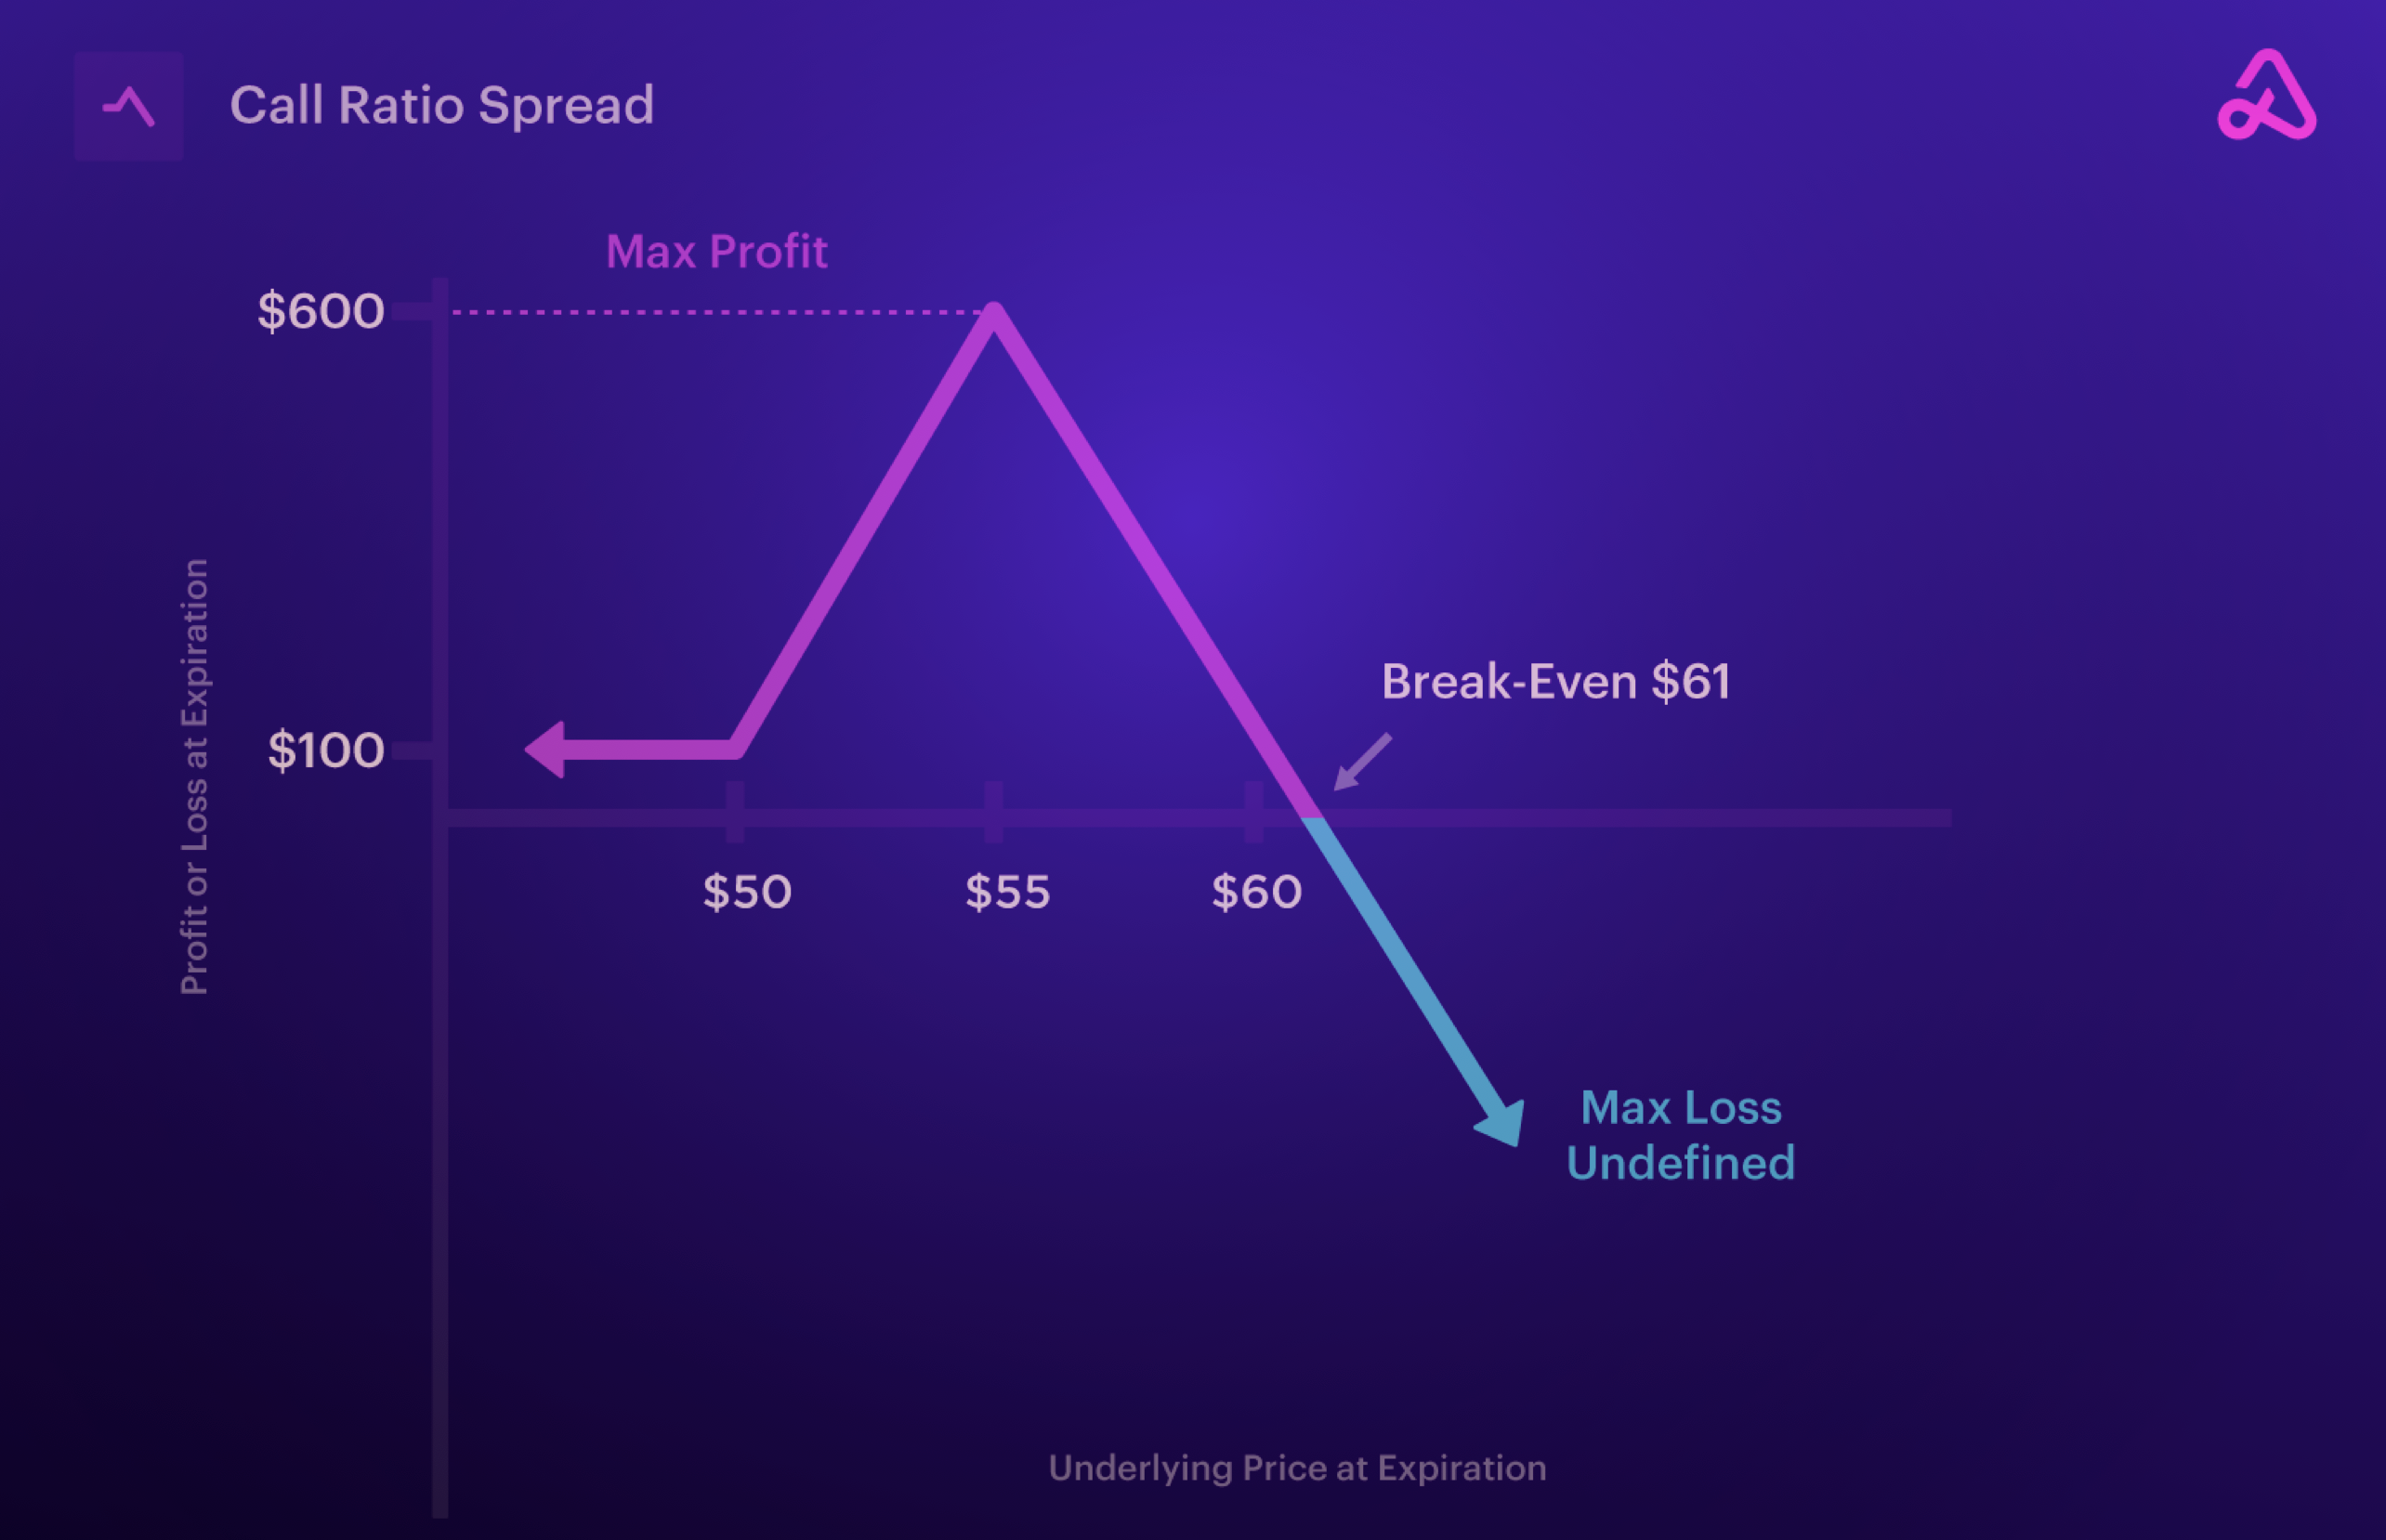
One of the biggest reasons someone might use a ratio spread is to lower the cost of entry by buying an expensive option and selling two options further out of the money. When left unhedged, this type of strategy can be directionally biased to a point, but the extra option sold eventually takes over the risk profile. The above chart shows a long ratio front spread where you can notice that we want the price to go up, specifically to where our short strike is, but if we exceed the short strike, then P/L slowly starts to decline until it is negative. If the spread is open for a Debit, there are two breakeven points: lower strike plus the debit, and higher strike - the max profit (distance between the strikes - the debit paid). If the spread is open for a Credit, there is one breakeven point: the higher price + the max profit (distance between the strikes + the credit).
Another reason to use a ratio spread is to take advantage of something called “Volatility Skew.” I will briefly cover Volatility Skew, but for a lengthier explanation, there are certainly some good articles out there.
What is volatility skew?
When we covered Calendar Spreads, we discussed term structure, a specific way to separate the volatility surface into tenor and volatility while keeping the strike the same. With volatility skew, we will separate the surface into strike and volatility while keeping the expiry the same. At its essence, volatility skew is a phenomenon shown in the pricing of options by the market. Black Scholes is a common way to view the pricing of options, but one of the concepts the model doesn’t account for is this volatility skew.
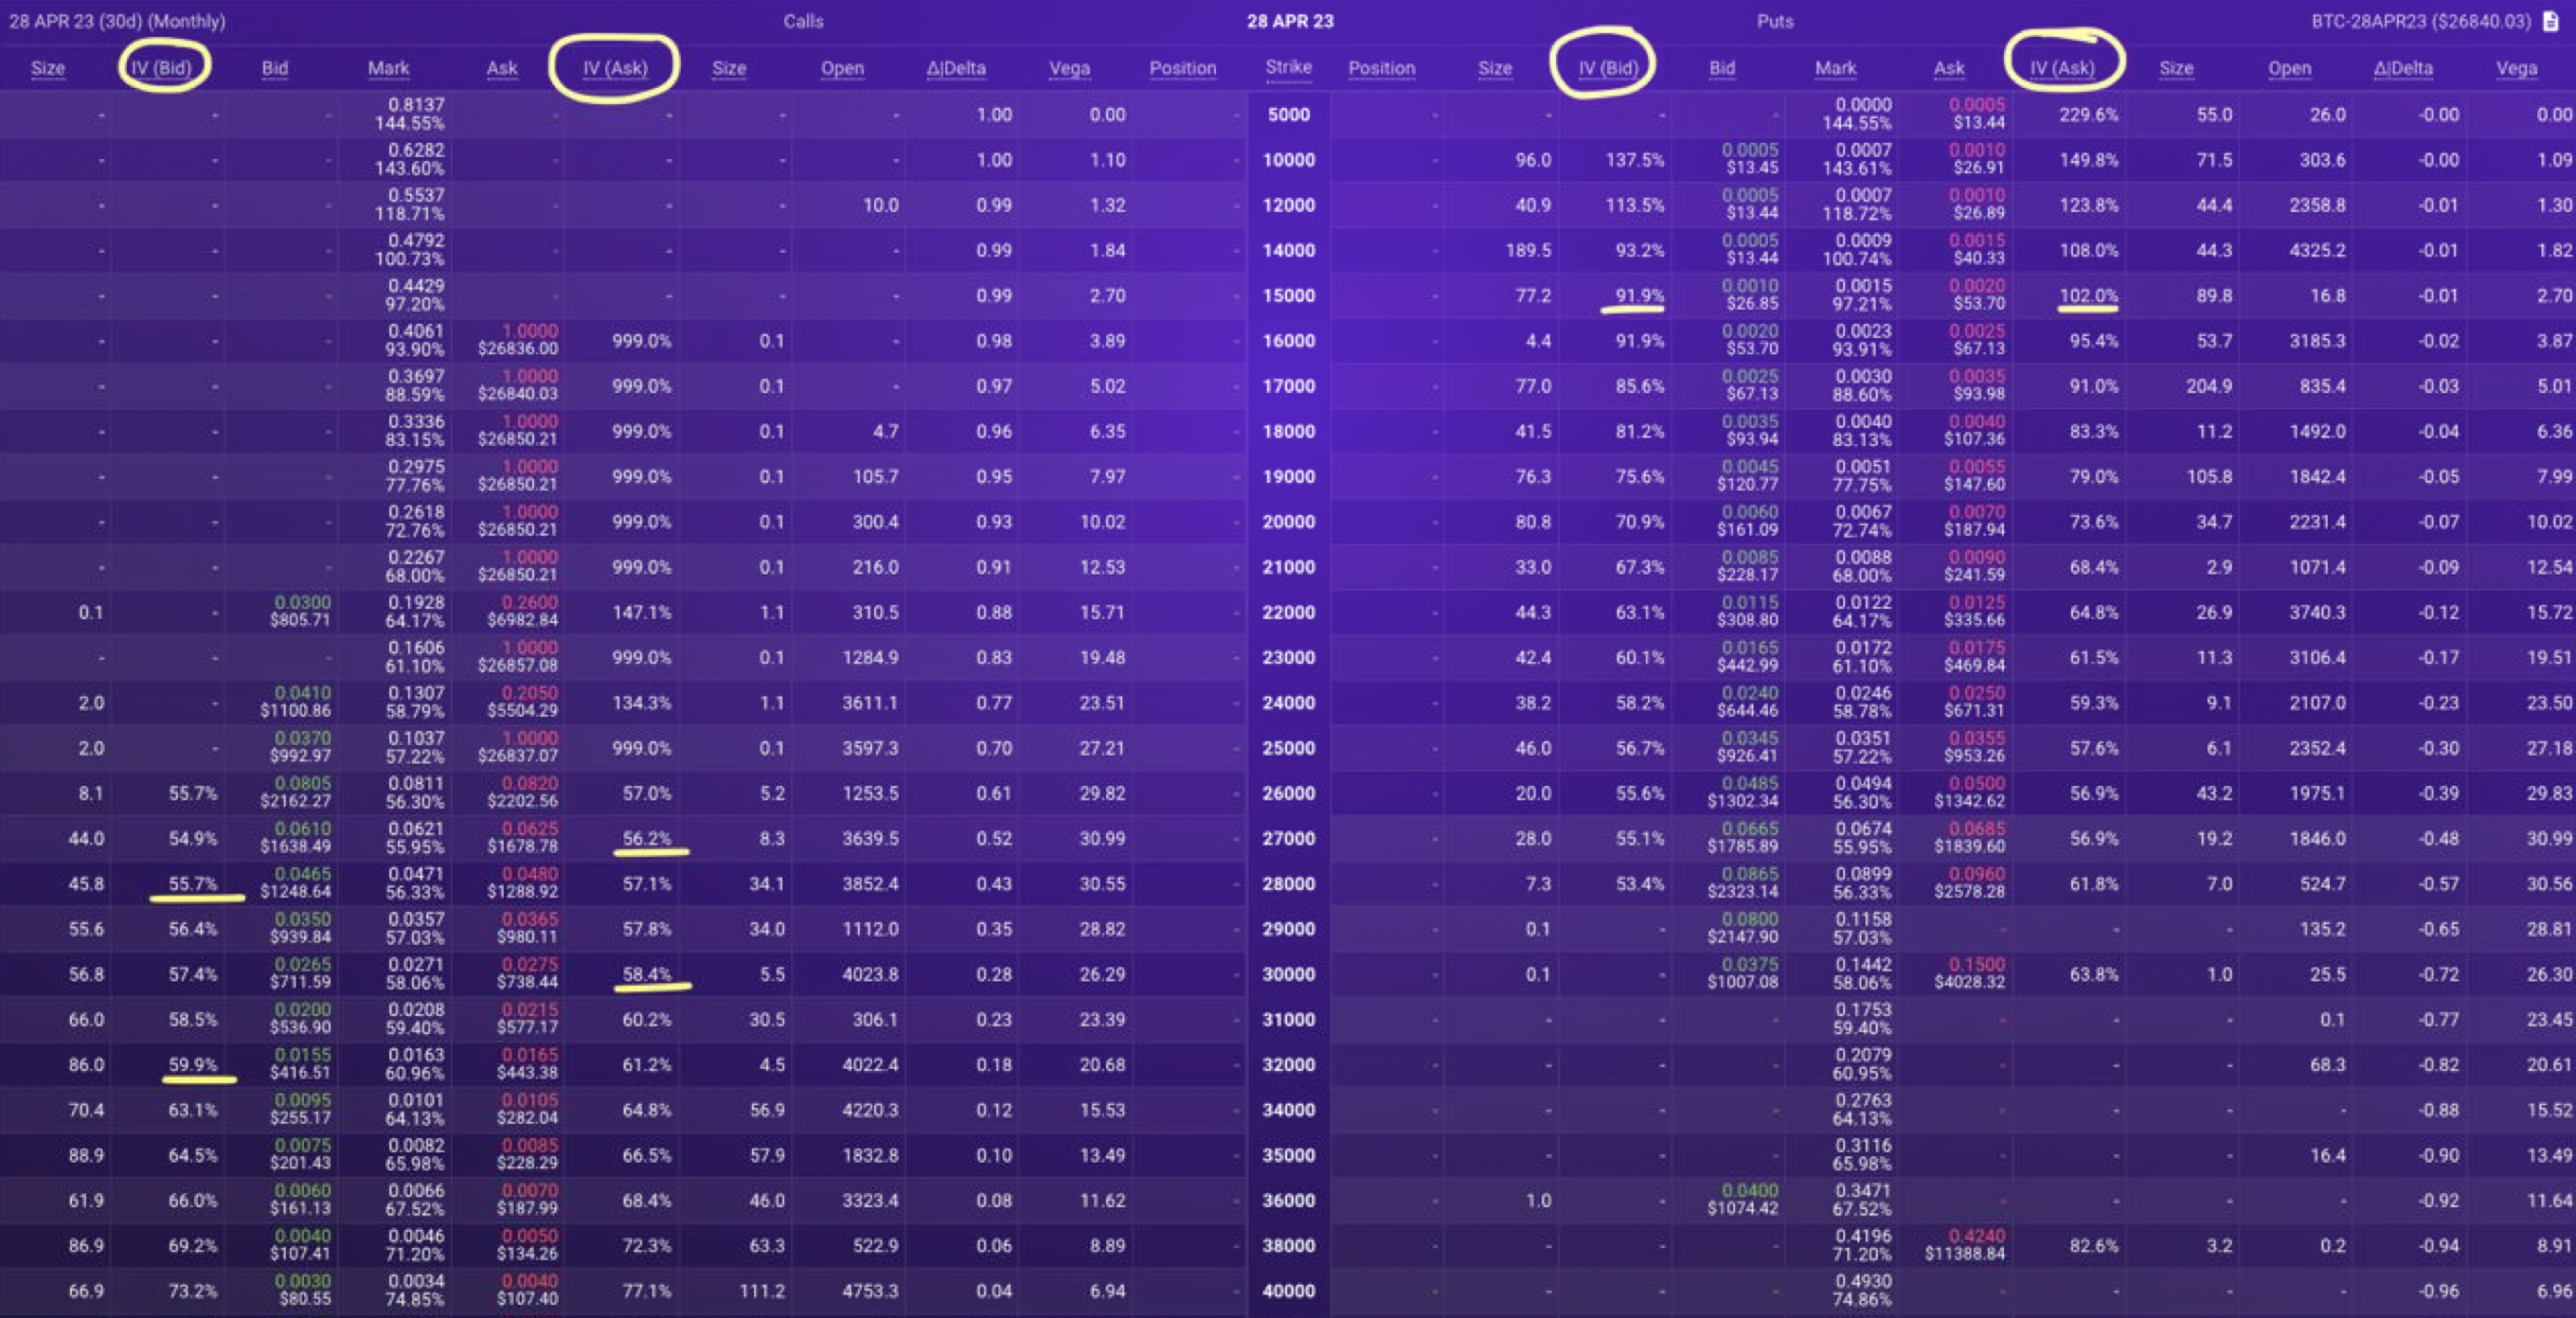
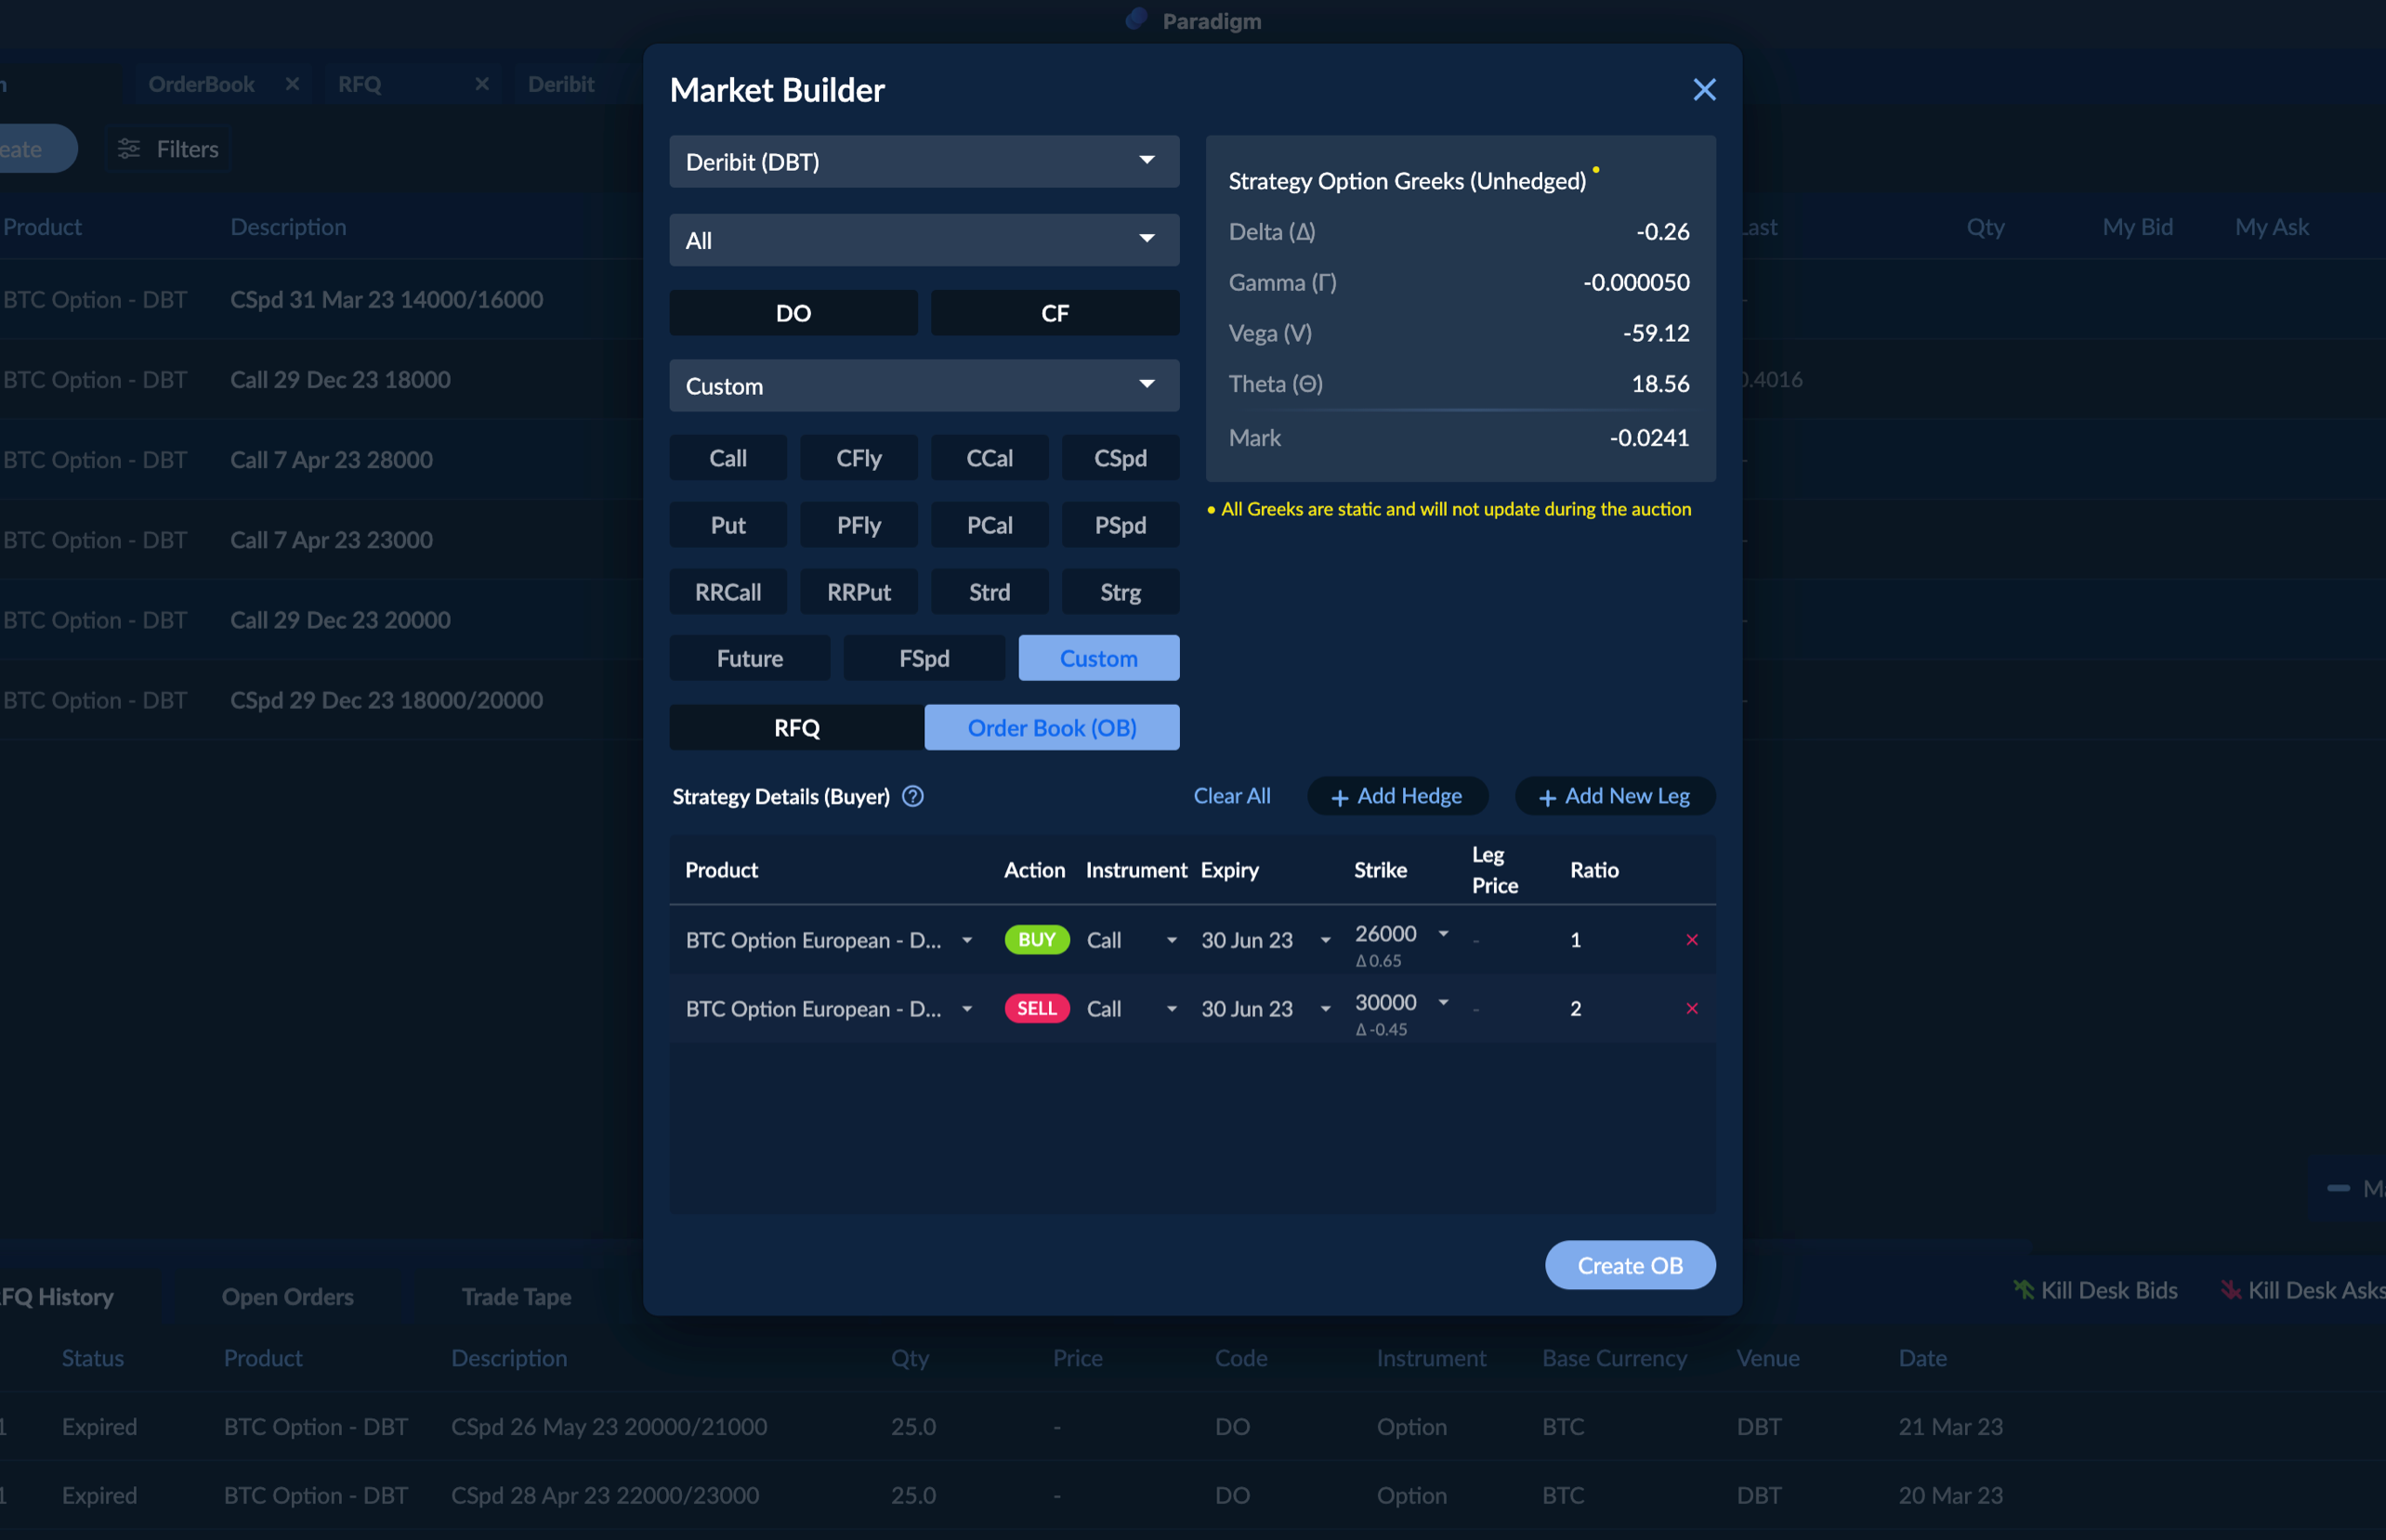
When pricing options using the Black-Scholes model, one assumes constant volatility. This is different in practicality when viewing the markets. Due to supply and demand dynamics when looking at a liquid options market, particular strikes can trade for higher prices in volatility terms. When considering trading volatility, the underlying options are typically delta-hedged upon inception or as quickly as possible to reduce the exposure to the underlying market. When this is the case, let’s consider option prices in volatility terms. In the below screenshot, you’ll see the prices in $ or token, but you’ll also see a % IV on the bid or ask.
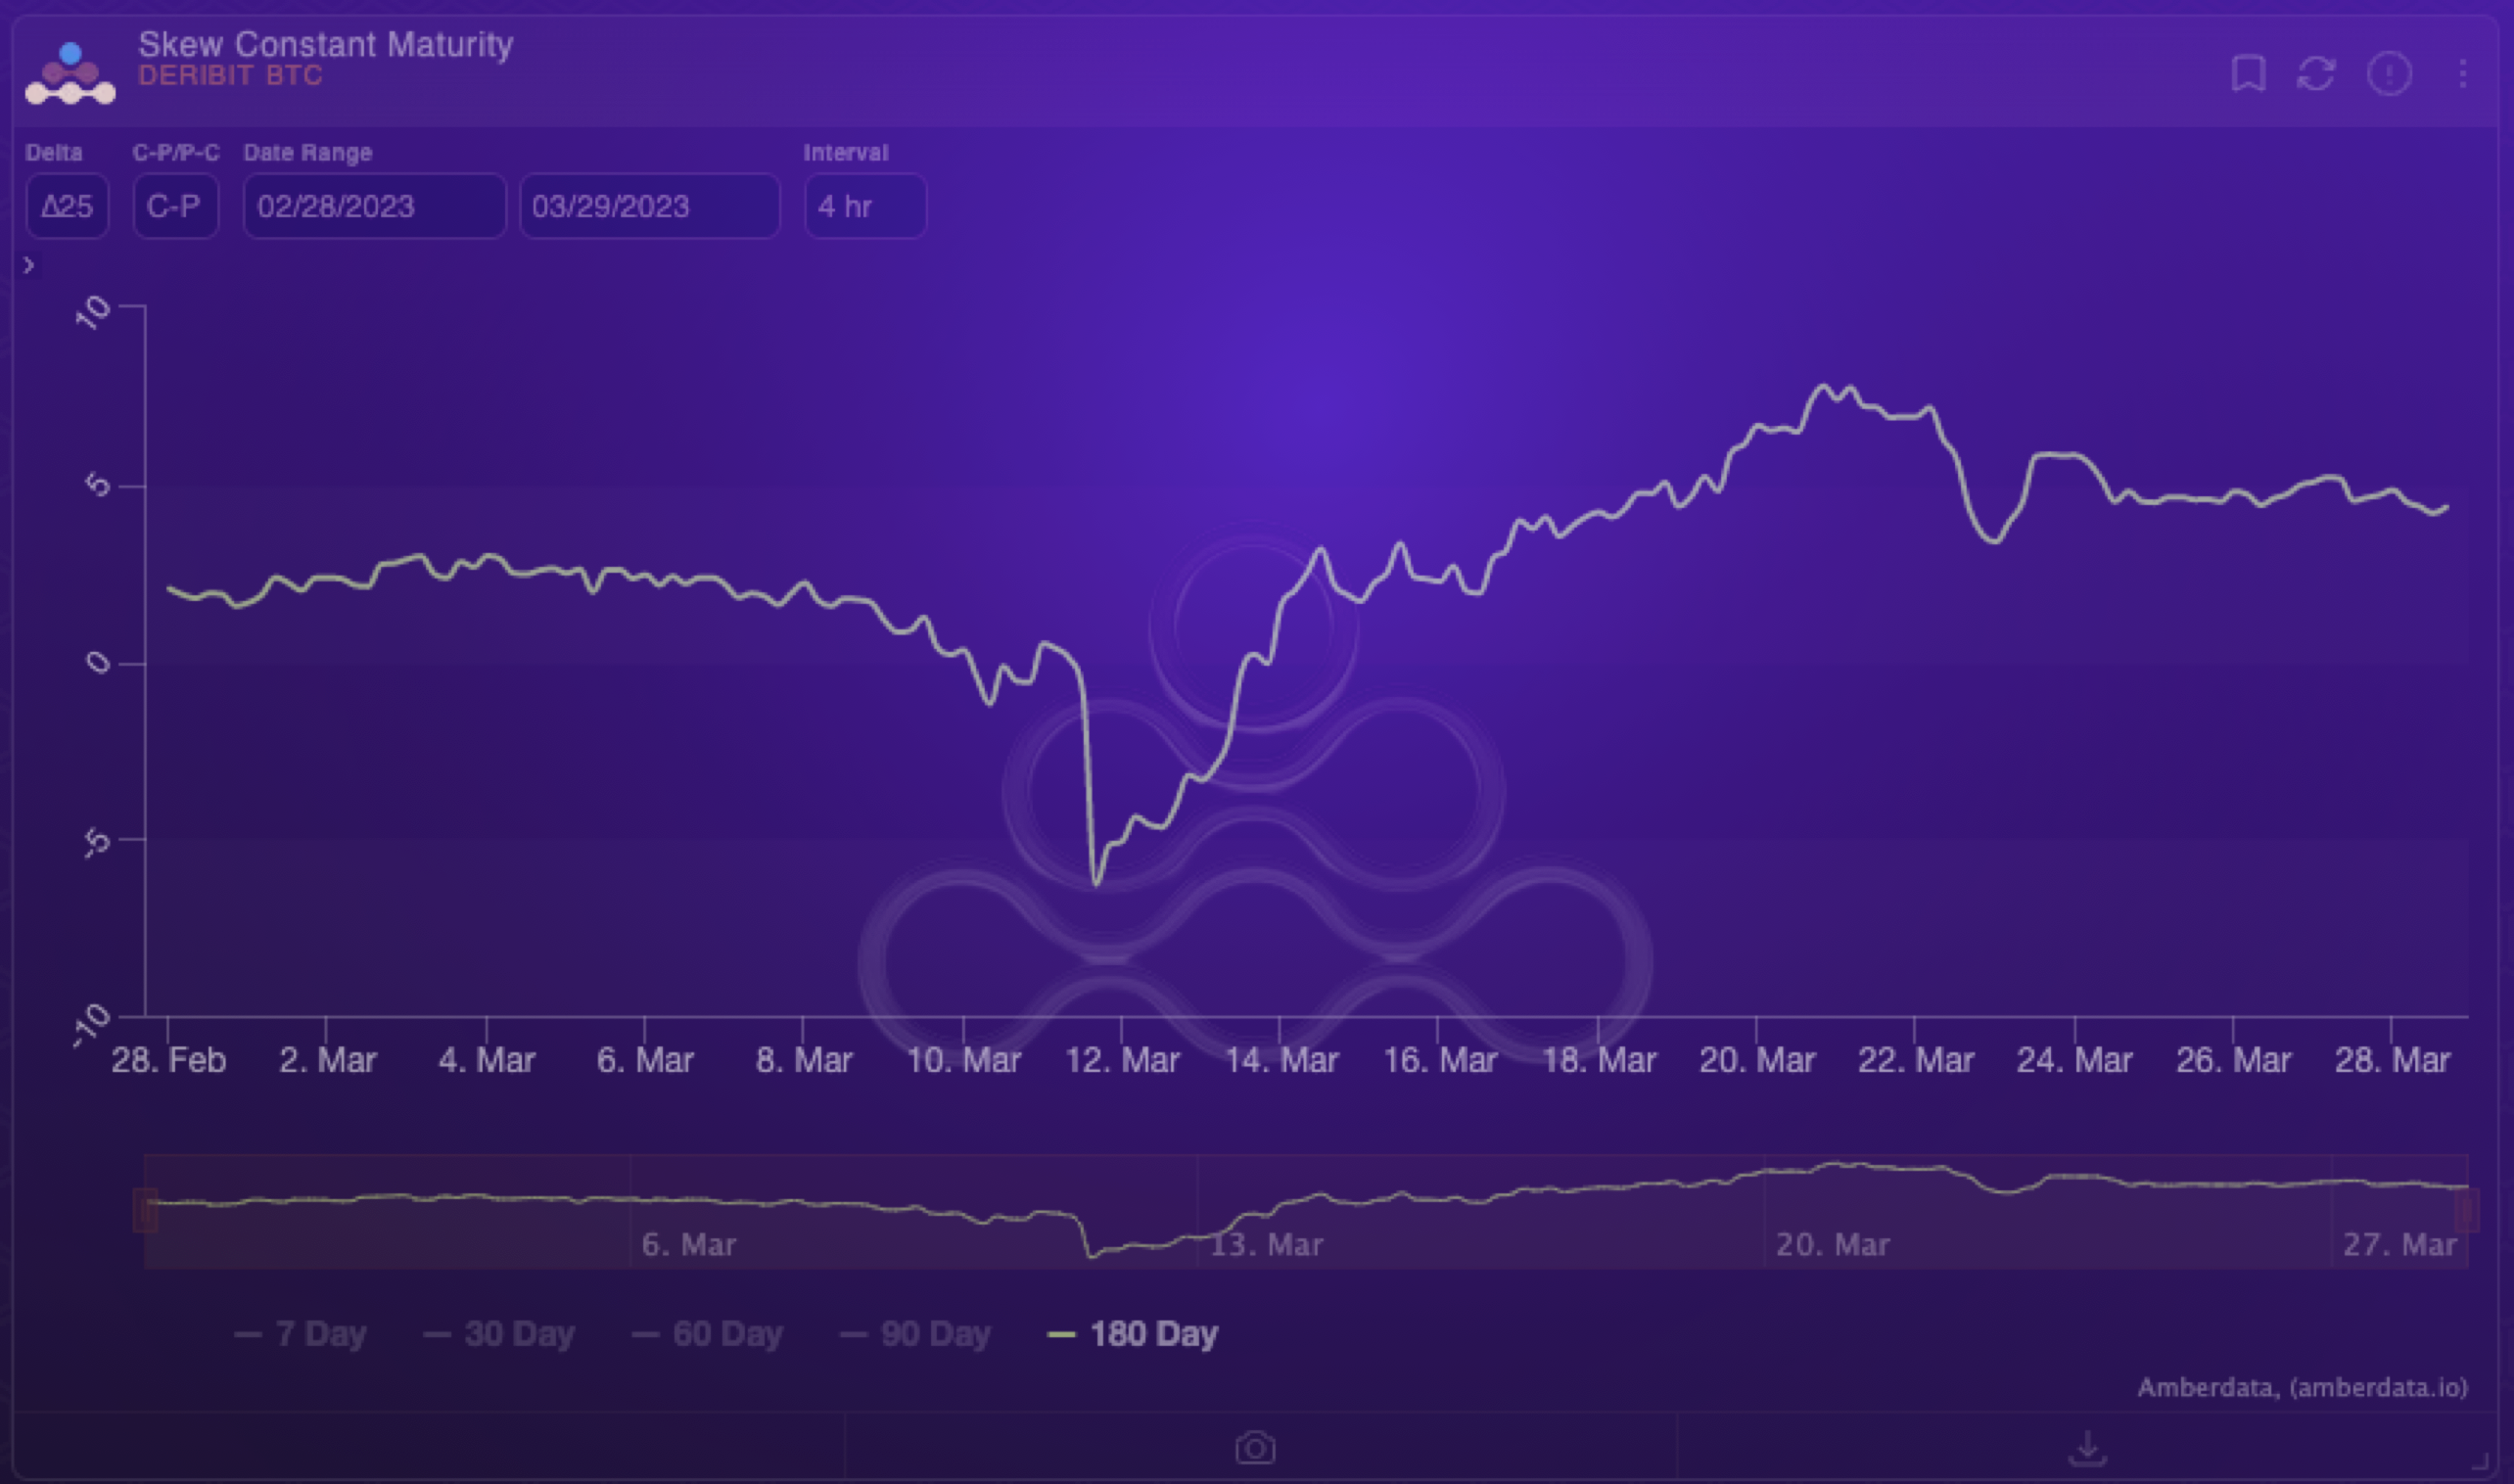
The below chart shows an example of a “Volatility Skew” curve. Skew can typically be referred to in the 25 delta, 35 delta, 15 delta, or any sort width parameter. Using this as a parameter, the graph's interpretation would show the difference between the 25 delta, 35 delta, 15 delta, etc. call and put. It is important to note that some people view skew as puts - calls and some view it as calls - puts. In the below example, this graph shows calls - puts and would show increasing volatility for OTM calls as the delta gets lower, and would also show the 25 delta calls trading at a premium to the 25 delta puts.
Skew can also typically be interpreted as a sentiment indicator for the broad market. As supply and demand shift for particular strikes of the same expiry, volatility skew starts to become prevalent. If demand for OTM calls starts to appear, then OTM calls start to trend higher in price as more and more people start to position themselves for a move higher. If people become fearful in the markets, demand for OTM puts starts to become prevalent, and those start to trend higher in price. There is also typically a combination in the crypto markets of overwrites in which call selling is accompanied by put buying, etc. so it’s important to know that not only a demand for puts but an absence of call buying can impact the volatility skew, and vice versa.
A pure way to trade volatility skew between calls and puts can undoubtedly be seen in a risk-reversal strategy - which we will cover in another article - but these types of ratio spreads typically position themselves to trade the volatility of similar underlying contracts (only puts or only calls). A 1x2 call spread takes advantage of the difference in demand of specific call strikes, a 1x2 put spread might take advantage of the difference in demand of certain put strikes. In contrast, a risk reversal would take advantage of the difference between the volatility of the puts and calls of a specific delta - i.e., Selling/Buying the 25 delta call and the opposite for the put.
Profit
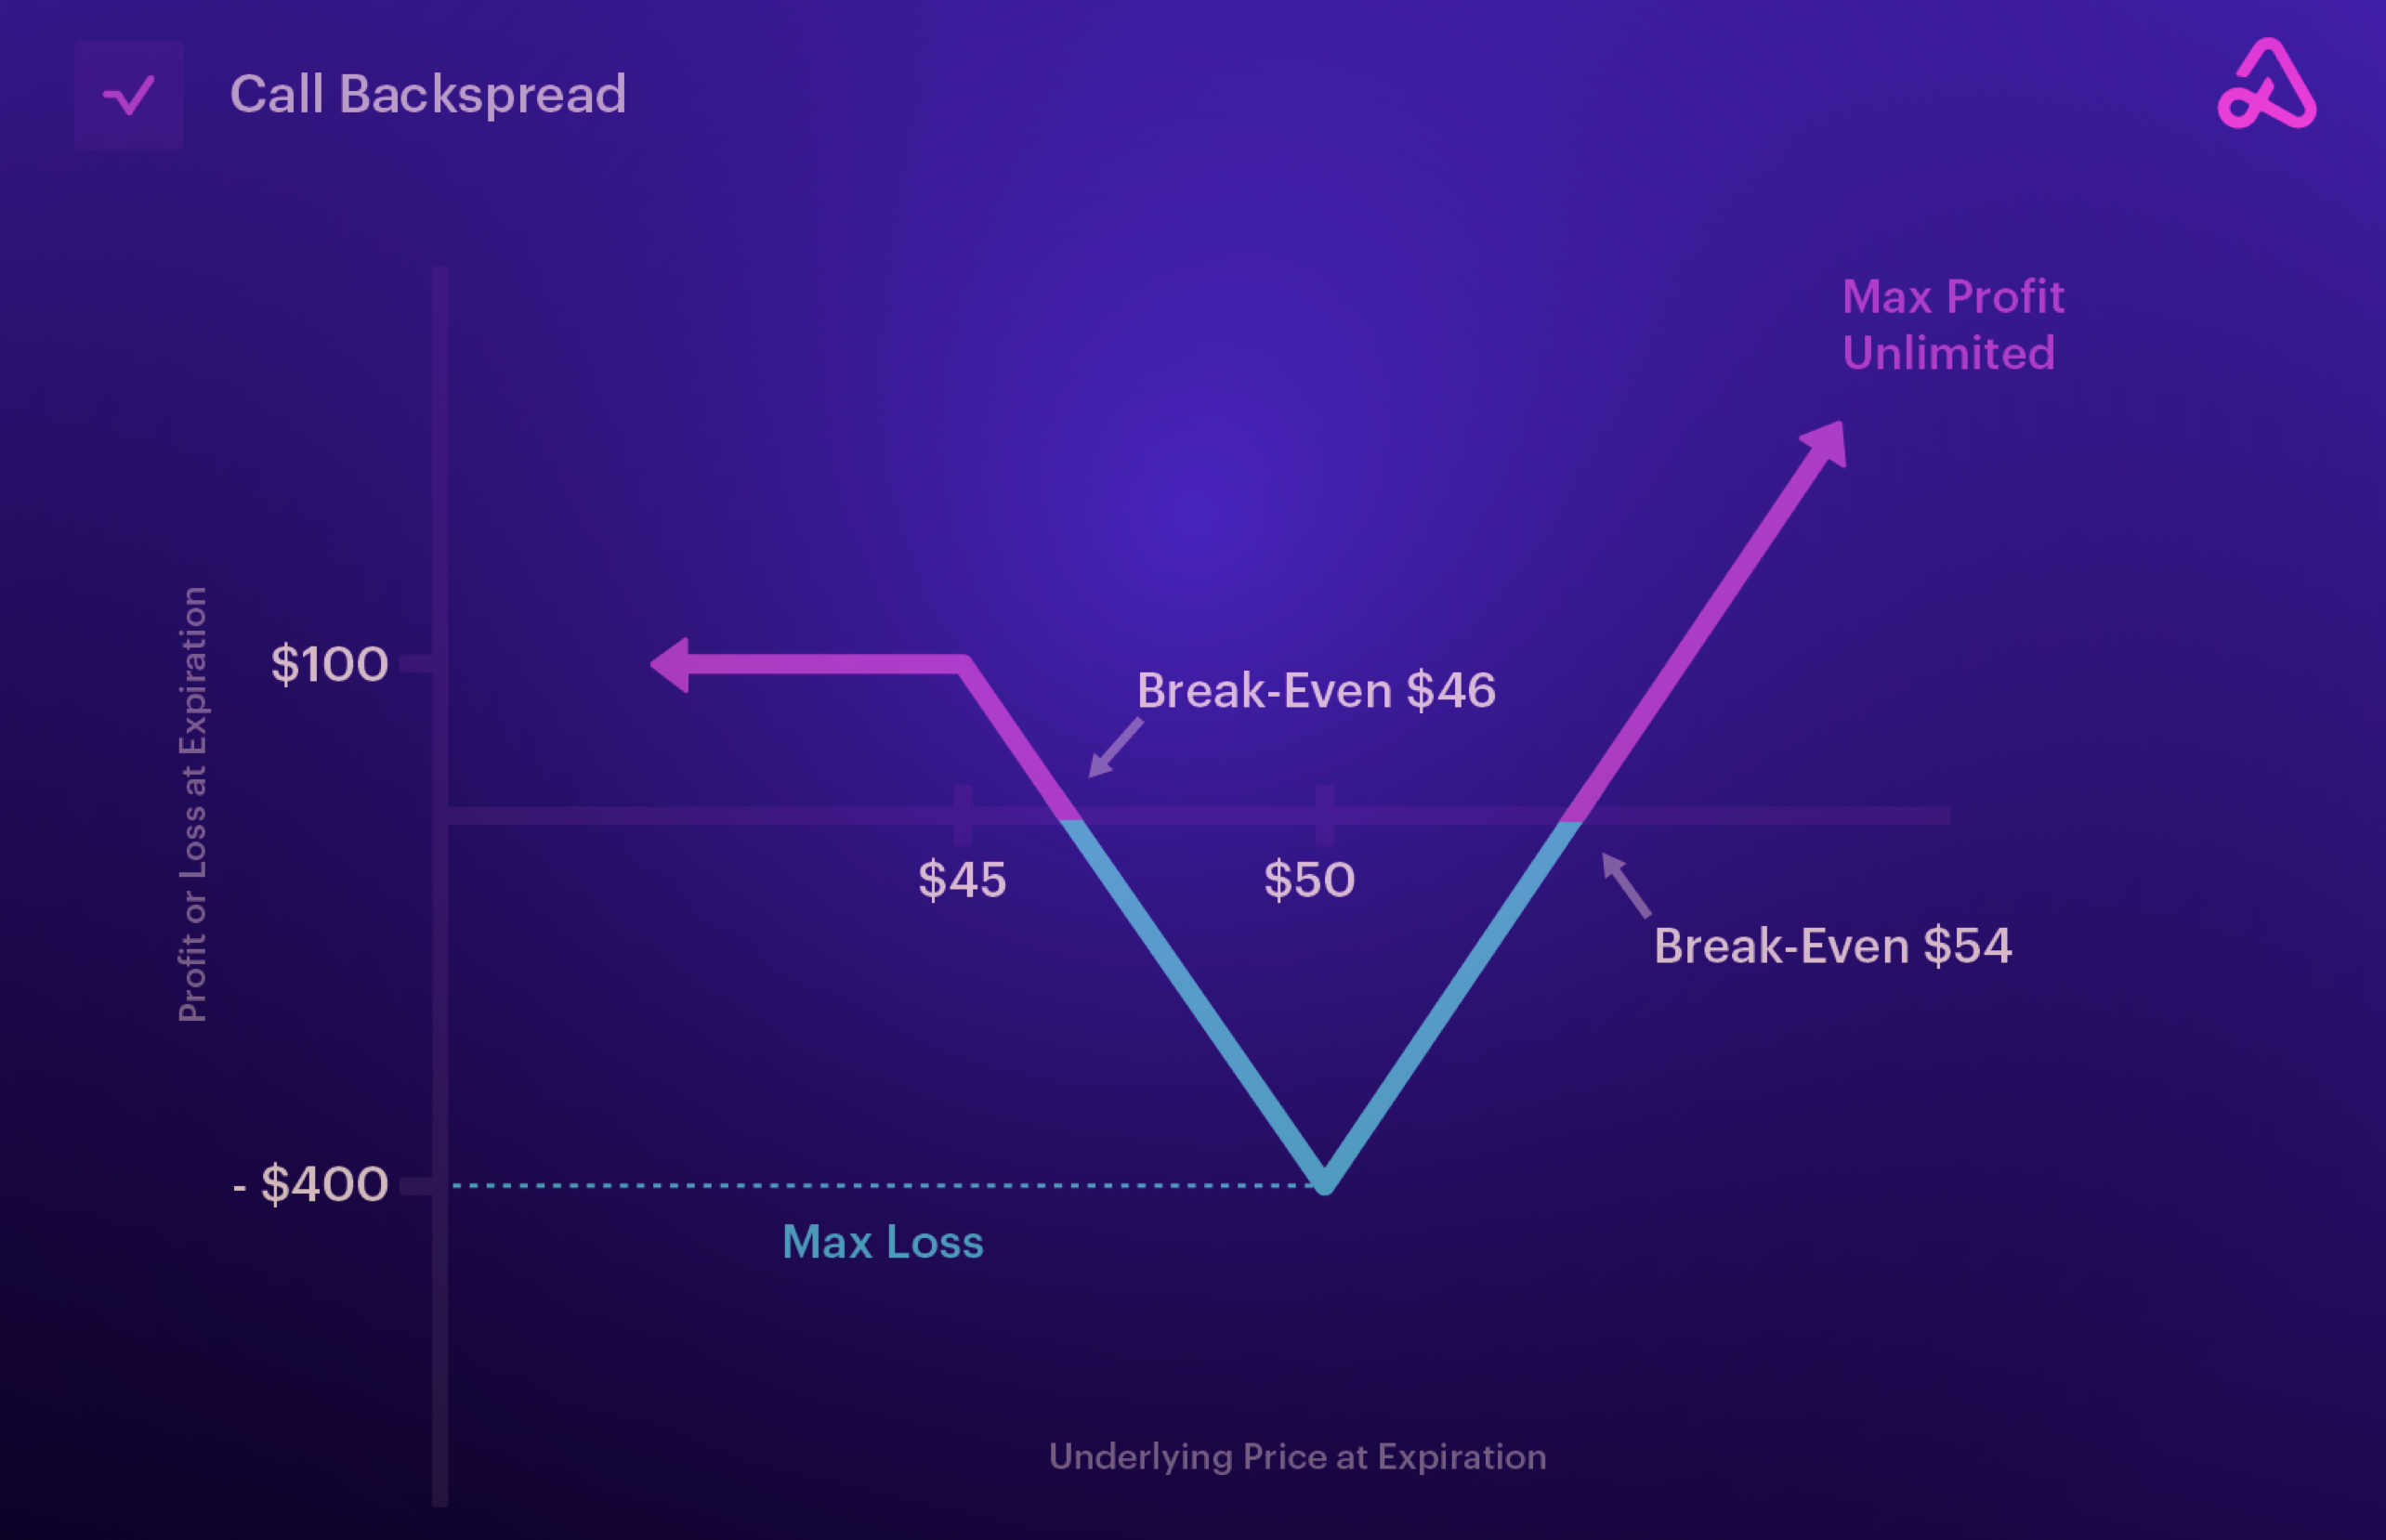
Undoubtedly, some obvious directionality is incorporated here, as we can see in the payoff diagrams. However, the other factor challenging to visualize through the Greeks is the exposure to volatility skew. This can be visualized more thoroughly by the SABR implied volatility model.
The graphs below show a simplistic way at expiry to think of P/L for both the ratio back spread and front spreads.
Conclusion
In summary, ratio spreads are an effective way to lower the cost to enter directional positions without being too overly biased, i.e., bullish but not too bullish or bearish but not too bearish. This plays out due to the design of the structure (A debit or credit spread + an additional option sold or bought). The other use case for ratio spreads is a bit more complex but incorporates dynamic delta hedging in which the main exposure a trader is looking to warehouse is the volatility skew - or the difference in price (in implied volatility terms) of specific option strikes of the same expiry. Certain implied volatility models, such as SABR, incorporate a skew parameter into their surface creation, but that is something to be covered in another article.

 @CryptoDeFiGuy
Heading 1
Heading 2
Heading 3
Heading 4
Heading 5
Heading 6
Lorem ipsum dolor sit amet, consectetur adipiscing elit, sed do eiusmod tempor incididunt ut labore et dolore magna aliqua. Ut enim ad minim veniam, quis nostrud exercitation ullamco laboris nisi ut aliquip ex ea commodo consequat. Duis aute irure dolor in reprehenderit in voluptate velit esse cillum dolore eu fugiat nulla pariatur.
Block quote
Ordered list
- Item 1
- Item 2
- Item 3
Unordered list
- Item A
- Item B
- Item C
Bold text
Emphasis
Superscript
Subscript
